Salesflash User Guide
Salesflash Overview
Advertising Sheet
The Advertising sheet contains a number of reports focused on what we thought Sales Reps and Advertising Managers would want to see. However, these groupings are just a way to separate reports and it doesn't mean that others won't find these reports useful.
Dynamic YTD Button
The idea behind the Dynamic YTD chart is to break you out of the constraints of the typical YTD which is determined by the current date.
Instead, based on your selections, the chart will produce YTD information with a moving date.
For example, if you want to look at YTD information based on what it looked like two months ago, you will be able to do that with the Dynamic YTD chart.
The Dynamic YTD chart is affected by the type of Year you have SalesFlash set to observe. This is something that should be set as a default in Salesflash, however you can change it for your session as you see fit. When type of Year is mentioned I'm referring to whether you are in Fiscal Year mode or Calendar Year mode.
You can easily tell which mode you are in by looking at the "Select A Year" list box:
| Fiscal Year Mode | Calendar Year Mode |
|---|---|
 | 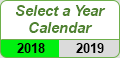 |
Here are the rules that must be followed:
- Since this is a YOY report, you will need to make a selection in the "Select A Year" list box.
- If you are in Calendar Year mode, then one or months selected in the "..._Month" list box. If you are in Fiscal Year mode, then one or more periods selected in the "..._Period" list box.
This chart also responds to changes in the type of date being used. In the Quick Select Ribbon, when you are on the "Date" tab, you have three date type options:
- Posting
- Insert
- Create
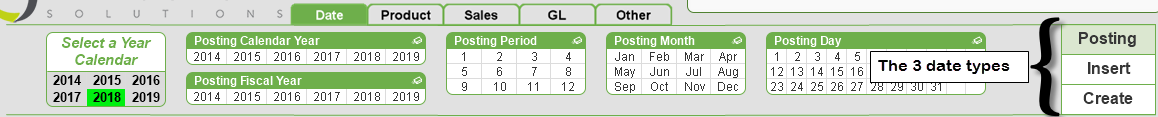
The Dynamic YTD chart will use the type of date that is active in its calculations.
For example, if you are in Calendar Year Mode and Posting date type is selected, then you would make your selections in the Posting Month list box. Here is what it would look like:
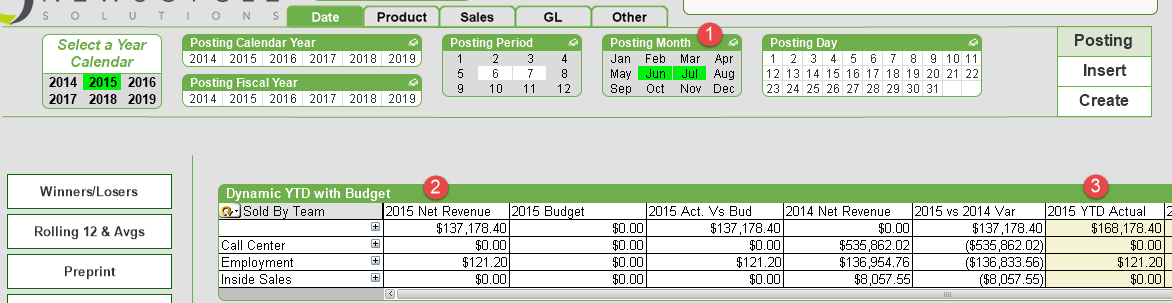
- Both Jun and Jul have been selected. The YTD calculation is going to extract the greatest month to use, which in this case will be Jul. You may select one or more months/periods, but the calculation will grab the greatest month/period.
- The Net Revenue expression column is going to show the revenue for the Posting Months you've selected and any other selection criteria. As for other date criteria, you may make other selections, but make sure you understand what the selections will do. For example, the Posting Day is really the only other date selection that makes any sense. By selection a posting day, you will be limiting both the Net Revenue and the YTD columns by the days selected.
- The YTD Columns will show you the revenue from Jan 1st of the year through the end of the greatest month/period selected in the Posting Month list box. In the example above, you would see revenue from 1/1 - 7/31
These same rules apply if you are in Fiscal Year mode, the only difference, is that you will want to make your selection in Posting Period.